Using Graphic Tools in Forex Tester 3
Forex Tester has a large variety of charting tools such as:
- Lines (Vertical line, Horizontal line, Trend line, Ray, Poly line)
- Shapes (Rectangle, Ellipse, Triangle)
- Signs (Thumb up, Thumb down, Arrow up, Arrow down, Stop sign, Check sign, Right price label, Left price label, Price label)
- Fibonacci tools (Fibonacci retracement, Fibonacci time zones, Fibonacci fan, Fibonacci arc, Fibonacci extension)
- Channels (Fibo channel, Linear regression channel)
- Andrews' Pitchfork
- Text label
- Wave symbols
You can find all of them in the "Insert" menu:
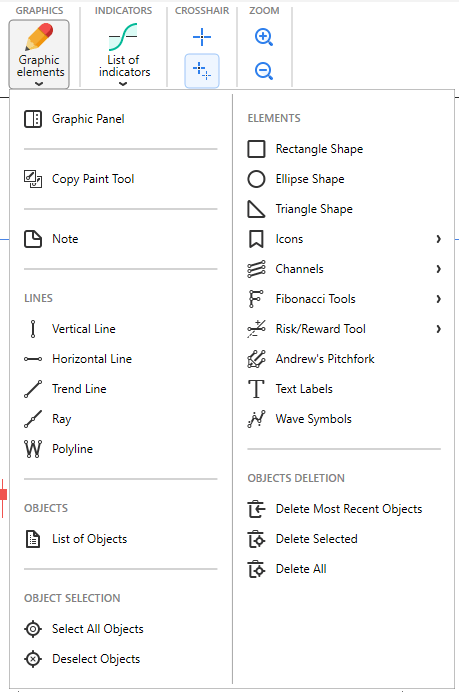
Also, you can find all these graphic instruments on the toolbar:

You can see an icon on the toolbar:
This icon sets a magnet mode. If this mode is activated, then the mouse pointer will stick to the Open/High/Low/Close values of the nearest bar on the chart. You can set a magnet sensitivity in the chart options (click the right mouse button on the chart and select the “Chart Settings” option).
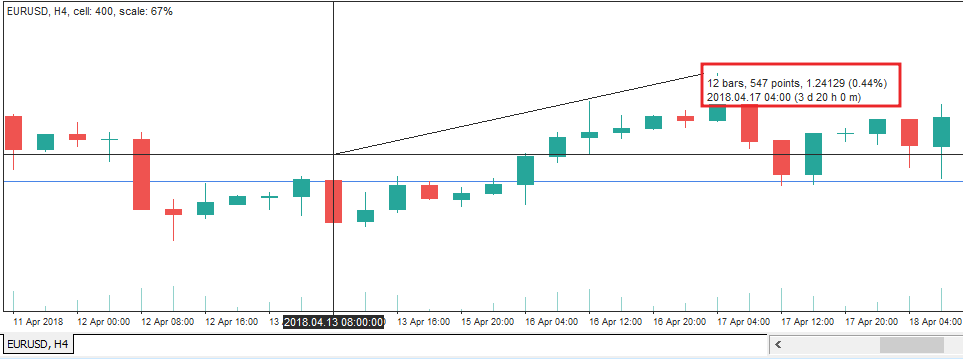
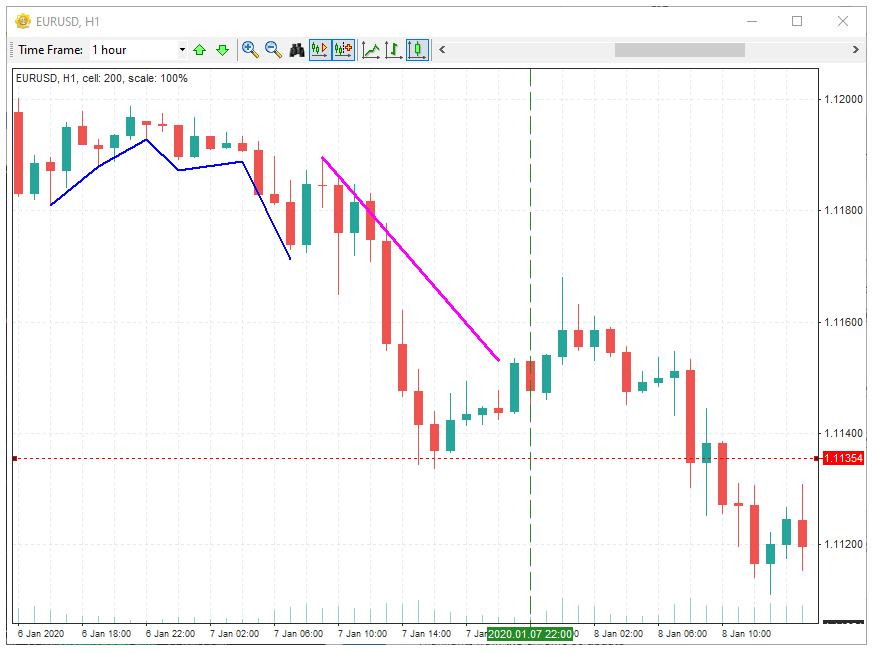
Drawing of the lines is pretty easy: select the tool and then click once with the left mouse to set the first point (in the case of the Vertical and Horizontal lines it will be only 1 point) drag your mouse and click to set the second point. If you decide to cancel drawing - just click the right mouse button - it will cancel the operation. Some tools like Poly line or Andrews' Pitchfork require more than 2 points to place.
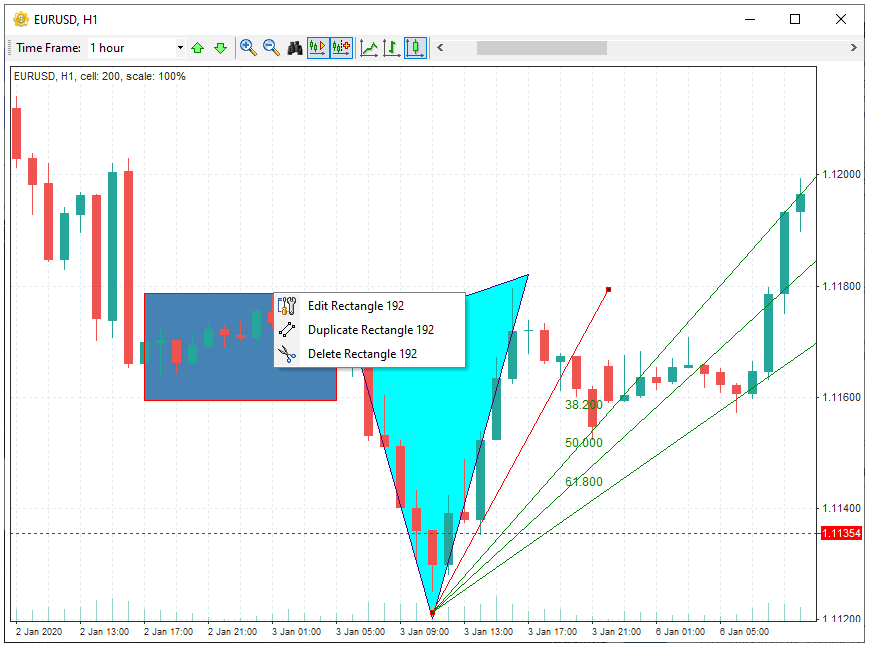
Each tool has its own properties. To edit them, right click on the tool and select Edit tool. You can also duplicate this tool or delete it with the help of this menu.
To select the tool, please double-click on it with the left mouse button. You will see white points which you can move to change the shape and position of the tool. If you press the Delete button on the keyboard, then all selected tools in this chart window will be deleted. To deselect the tool, double-click on it with the left mouse button again.
There are some hotkeys that will help you to manage graphic tools:
Ctrl + G - to select all the tools on the chart.
Ctrl + D - to deselect all the tools on the chart.
Ctrl + Del - to delete last added tool.
Ctrl + A - to delete all the tools on the chart (selected or not).
Delete - to delete only selected tools on the chart.
Note that all the hotkeys can be changed via the Tools → Options menu.
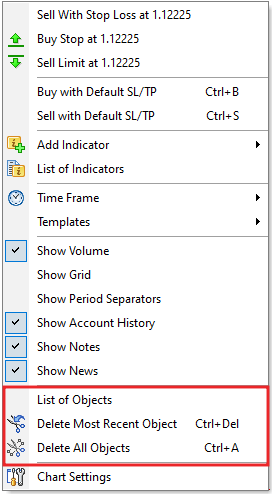
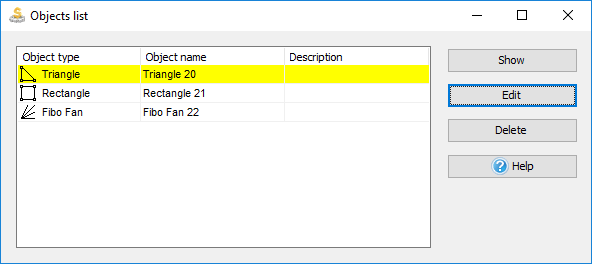
You can see these shortcuts through the Edit menu. Also in this menu, you can open the List of objects where you will see all tools that are currently added to a selected chart and change or delete any of these tools.
The Objects list dialog has the following view:
Short Answer:
Tags: usedraw|
Comments:
Leave a comment