How to use Statistics in Forex Tester 3?
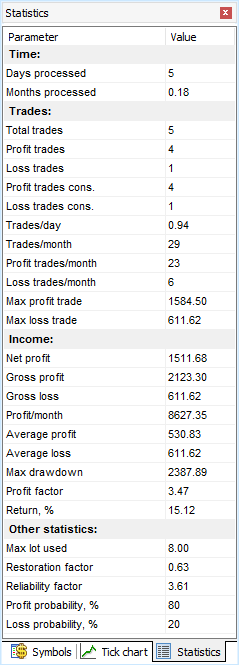
The statistics on the strategy’s performance is displayed during the test and after the testing is finished. The "Statistics" window shows the most important indicators such as:
→ the number of total profit and loss trades
→ maximum profit and loss trade
→ net profit
→ profit per month
→ average profitable and losing trade
→ maximum drawdown
→ and many others
Profit chart is an individual chart that contains the specific candlestick chart and three additional lines:
- The Balance line, the green one, displays your deposit’s changes.
- The Margin line is colored in gray.
- The Drawdown line is painted in red color.
- The Equity chart is a set of candlesticks that gives a visual comprehending of how the equity has been changing.
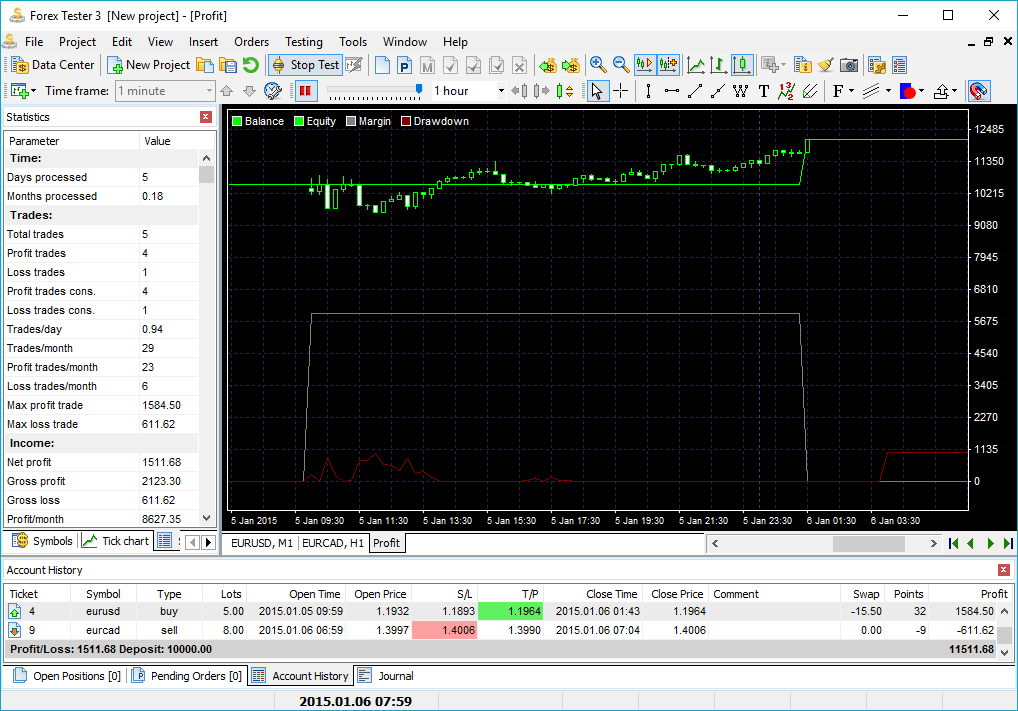
The main difference between the balance and equity is that the balance line can be built only when the trade is closed whereas the equity line shows all the changes in the account for the opening trades.
If you right-click on the "Statistics" window, you will be able to export these data to Excel or to a .txt file. You can disable statistics window in "View → Show panels → Statistics".
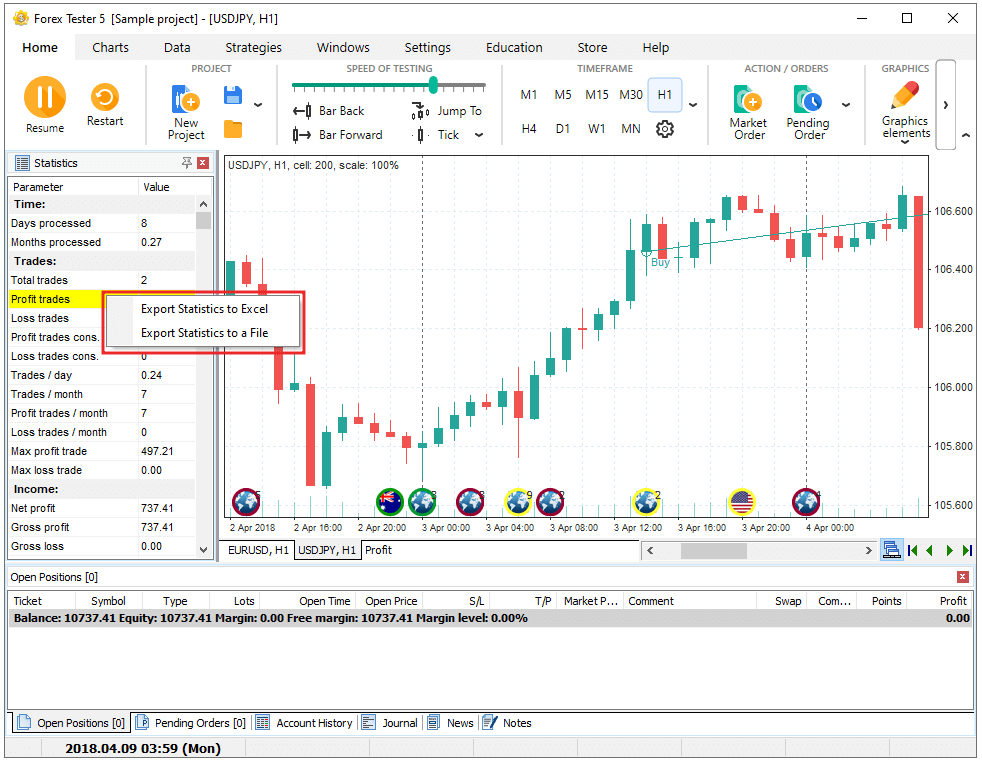
Also, you can export the account history to Excel or text file by clicking the right mouse button on the "Account history" tab and selecting a necessary export option.
Short Answer:
The statistics on the strategy’s performance is displayed during the test and after the testing is finished. To learn more about using trading Statistics in Forex Tester 3 please follow this link.
Tags: statistics|
Comments:
Leave a comment