Chart settings and “View” menu in Forex Tester 3
Forex Tester provides its users with six chart modes. Three of them are situated on the toolbar and in the “View” menu.
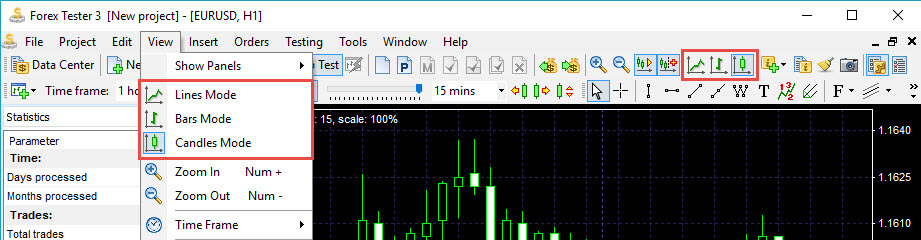
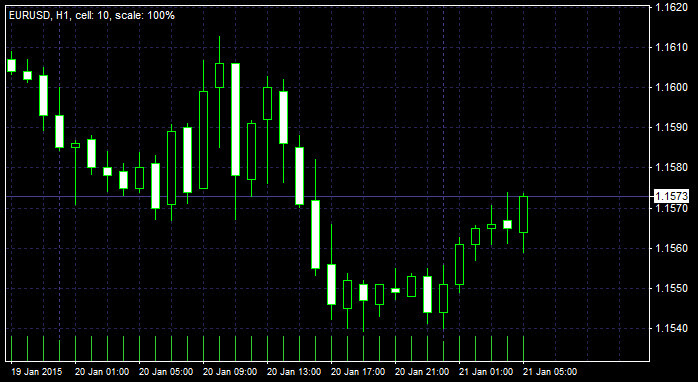
The first one is the Candlesticks mode. Candlesticks are set in Forex Tester 3 by default. Candlesticks are the vertical rectangles of two colors that might have upper and lower wicks.
The second one is the Bar mode.This mode consists of the vertical bars with horizontal line segments. Vertical bars display the distance between the high and the low of the current bar, whereas the left horizontal lines show the open price of the bar and the right horizontal line provides information about the close price.

The line mode, the third one, is the polyline that joins all the local maximums and minimums.

The fourth mode is the Range bars mode. To switch to this mode please navigate to the “File → Add new range bar chart” menu and then click on the currency pair for which you need to create a Ranger bar chart.
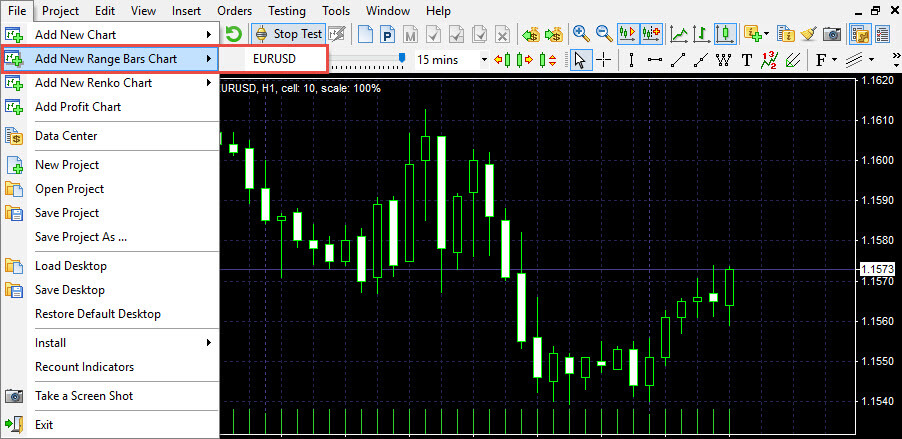
After that, Forex Tester will ask you about the “Range bar size”. Insert the necessary value and click OK.

You will notice that the spread of each candlestick or bar will be equal to the value that you have previously entered.

The fifth mode is the Renko bars mode. To enable it you need to navigate to the “File → Add new Renko chart” menu. Further, you should identify bar size in pips and click OK. Please note that Renko bars size is size of bars body without shadow.

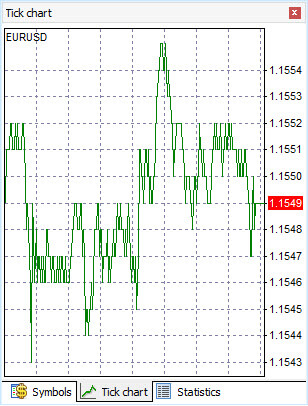
Finally, the sixth mode is the Tick chart mode. It shows every single price change within a current data range. To switch to Tick chart you should click on “Ticks” tab in left upper corner of the screen.
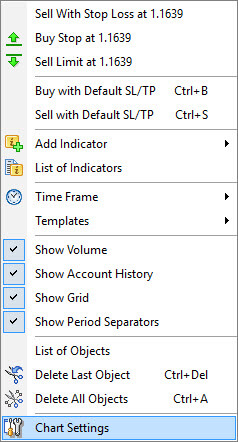
By default, all up-candles have lime color borders with a black fill. All down-candles have lime color borders with a white fill. You can change the colors of the candlesticks and chart’s background by right-clicking on the chart and selecting the “Chart settings” option.
There are nine color schemes available in Forex Tester. Let’s change the default one to “Black on White” scheme. This inverts the fills’ colors and sets the black borders of the candlesticks. Now the bullish candlestick has the white fill whereas the bearish one has the black fill.
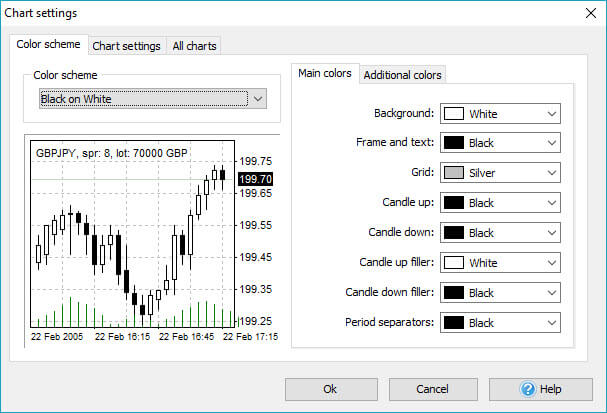
You can also alter the colors for the:
- background
- frame and text
- grid
- borders of the candlesticks
- fills’ colors
- period separators
Switch to the “Additional colors” tab and you will have access to other important lines that appear on the chart. By default, stop loss, take profit values, loss trades and buy order markers are colored in red. Orders’ levels, profitable trades, volumes and sell orders markers are painted in green color. You can change all of these lines and set any color you like using the dropdown menu to the right from each option.

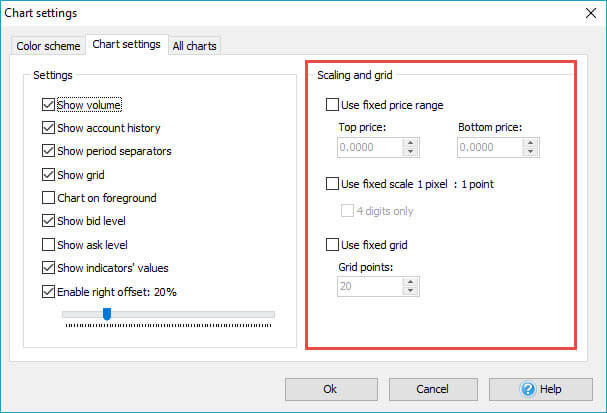
In addition, you can switch to the “Chart settings” tab and check or uncheck many different options.
You can deselect the “Show volume” checkbox – this will make a volume indicator disappear.
When you open and close trades, the open and close points, become connected with a line. You can switch that line off if you need. In order to do that, please right-click, select the “Chart settings” option, choose the “Chart settings” tab and uncheck the “Show account history” checkbox.
The “Show period separators” checkbox enables the dotted vertical line that appears at the end of each trading day.
You can disable the “Grid” if you find it distractive. The grid is the set of dotted rectangles that simplify the navigation on the chart. Each grid’s line provides a trader with the information about the price and the time of the candlestick.

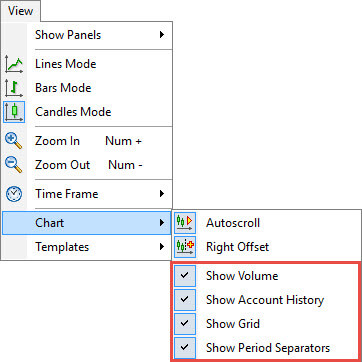
Period separators are dotted vertical lines that appear at the beginning of the day. Grid is the set of dotted rectangular that help to see the coordinates of any point on the chart.You can also enable or disable pre-cited parameters if you right-click on the chart and choose the necessary option.As an alternative, you can navigate to the “View → Chart” menu and find the same options there.
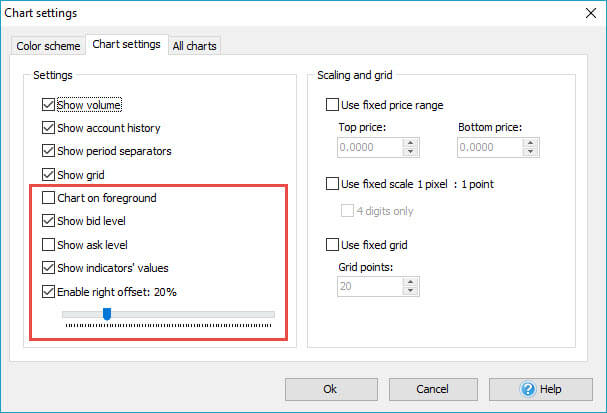
If it is more convenient for you to see the indicators and account history line beneath the candlesticks line then you can put to use the “Chart on foreground” checkbox.
Bid level is the line that shows at which price the sell order will be filled if you open a sell market order.
Likewise, the ask level is the line that shows at which price the buy order will be filled if you open a buy market order.
You can enable or disable these lines in the “Chart settings” tab.
If you have an indicator on your chart, then its current value may be displayed with a red color at the price axis. You can enable/disable these options in “Show indicators’ values”.
Right offset is the space from the last candlestick to the price axis. If you disable this checkbox, then no space will be visible to the right from the candlesticks.
You can set the offset using the scrollbar.
If you enable the “Use fixed price range” checkbox, and then type in the values for the top and the bottom price you will be able to see the objects that are situated in this vertical range only.
When the “Use fixed scale 1 pixel: 1 point” checkbox is disabled you will notice that the local maximum and minimum are always visible. If you enable the checkbox, then the vertical size of the candlesticks will be changed, and the changes will vary depending on the screen resolution of your monitor.
By default, the grid’s horizontal line is drawn after each five pips. You can change this value if you enable the “Use fixed grid” checkbox and type in the custom value for your grid. Let’s type “30” in the “Grid points” input and click “OK”. This will increase the distance between the grid’s lines.
In the “All charts” tab you can change the scrolling speed, mouse and magnet sensitivity. If you set the scrolling speed’s value at 10, then you will be able to scroll 10 times faster compared to the “1” value. To test it out click anywhere on the chart and hold. Then drag the mouse to either the right or left and you will see the speed of scrolling.
To test the “Mouse sensitivity to lines” parameter you need to add a line to the chart. After that double-click on it, and use the drag and drop method to reposition the element. If the value of the “Mouse sensitivity to lines” equals to 3 then even if you click 3 pixels away from the line it will still be moved.
To make the candlesticks thinner and therefore to include more of them on the chart without scrolling:
- You can click on the “Decrease chart scale” button on the toolbar
- You can also navigate to the “View → Zoom out” menu
- At last, you can click on the “Minus” button on the calculator section of your keyboard.
To make the candlesticks appearance more prominent:
- You can click on the “Increase chart scale” button on the toolbar
- You can also navigate to the “View → Zoom in” menu
- At last, you can click on the “Plus” button on the calculator section of your keyboard.
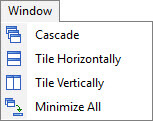
To reposition the chart windows, please use the options from the “Windows” menu:
- Click “Cascade” to make the windows stacked one on another
- Click “Tile horizontally” to make the windows stretched from the left to the right
- Click “Tile vertically” to make the windows stretched from the top to the bottom
You can enable or disable any of nine panels available in Forex Tester. Please navigate to the “View → Show panels” menu and click on the desired panel:
- The “Symbol” panel displays all the currencies that are involved in the project. You will see bid and ask prices as well as the spread value
- The “Tick chart” shows the price changes within the current bar. On this example, you can see that the bar was opened at 93.41 pips. Then the price went down and reached the 93.35 value. At last, the bar was closed at its high level at 93.42.
- The “Statistics” chart provides traders with all necessary information on their strategy’s performance.
- The “Scripts” window contains all available scripts. Script is the algorithm that will be run once by the user’s demand
- The “Data” window includes the information on the current bar such as: the date and the time when the bar appeared, the open, high, low and close prices, the tick volume and the bar index. To get information on the bar you need to hover your mouse on it. In case if you want the information regarding some particular bar to be displayed all the time no matter if you hover on this bar or not, please make use of the “lock index” checkbox and set the index of the locked bar. Please note that the bars count begins from 0 and not from 1. In addition, the calculation goes from right to left.
- The “Open positions” tab displays all opened orders
- The “Pending orders” tab shows the pending orders only
- The “Account history” tab shows all the closed orders
- The “Journal” provides users with the technical information on indicators that have been loaded, with orders placement, modification, and closing, with test start, end, etc.

To clear the "Journal" you can use the "Clear journal" button on the toolbar 
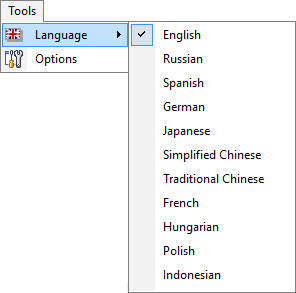
Forex Tester 3 is translated into 10 languages so you can experience using the software in your native language. To change the language you need to navigate to the "Tools → Language" and then pick the necessary option.
If you navigate to the "Tools → Options" menu, you can notice 4 tabs in the window that appeared. The "Default orders" will be especially useful for you in case if you often open orders with the same parameters. For example, if your strategy requires opening of the order with the stop loss of 40 pips and the take profit of 60 pips with the same lot size of 0.2 then you can easily set it up.
- Click on the "Add" button
- Set the "0.2" value from the dropdown menu that is situated to the right from the "Lot" option
- Enter "40" manually or using the dropdown menu near the "Stop loss" option
- Enter "60" manually or using the dropdown menu near the "Take profit" option
- Add a comment if you need it
- Click "OK"

Now, you've added a default buy order. Whenever you need to open your standard order with the above-mentioned values, just make use of the CTRL + B shortcut.The same procedure can be set for the default sell order that becomes placed with the help of the CTRL + S shortcut.The second tab is called "Hot keys". Here you can find out all the actions that are applicable in Forex Tester and find their Hot Keys equivalents. If you need to change the existing hot key value or to set one for a non-set value, double-click on the shortcut name and then select a necessary shortcut from the dropdown menu.

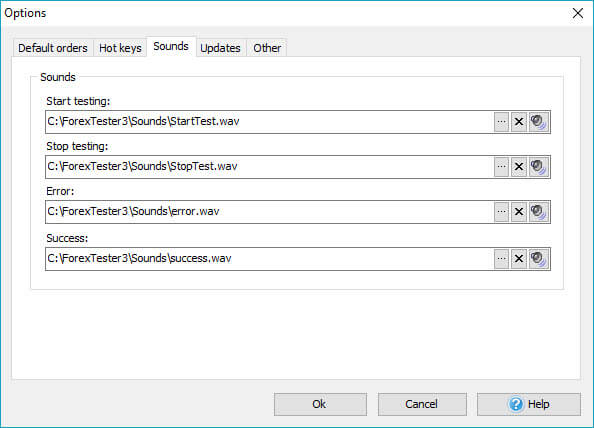
In the "Sounds" tab, you can set, delete or listen to the 4 sounds that exist in Forex Tester. These sounds represent the .wav files that will be played when you start or stop the test when an error or a successful action occur.
To set your own audio file, click on the "Open file dialog" button.
To delete the sound use the "Cross" button.
To listen to the existing sound, click on the "Speaker" icon.
In “Updates” tab every user can set periodicity of updates from server requests. You can also disable this setting so the program never tried to update till the newest version.

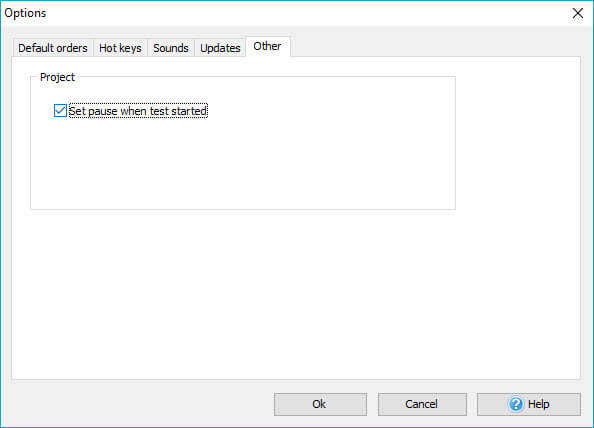
In “Other” setting “Set pause after start test” can be activated. When this option is enabled, after clicking on “Start Test” button new bars will not appear till you click on “Pause”.
Short Answer:
Tags: views|
Comments:
Leave a comment